Proper diversification can reduce the risks associated with holding only one type of investment opportunity and has been shown to favourably contribute to return potential.
At times, preferences for certain asset classes, market capitalizations and/or home country bias, drive investment decisions which can result in less than optimal results.
Investment solutions with built-in asset allocation features can aid in avoiding these pitfalls and help to best meet the intended portfolio objectives.
| 2011 | 2012 | 2013 | 2014 | 2015 | 2016 | 2017 | 2018 | 2019 | 2020 |
|---|---|---|---|---|---|---|---|---|---|
| Cdn. Bonds 9.67% |
Int’l Stocks 15.29% |
U.S. Stocks 41.27% |
U.S. Stocks 23.93% |
U.S. Stocks 21.59% |
Cdn. Stocks 21.08% |
Int’l Stocks 17.36% |
Global Bonds 7.70% | U.S. Stocks 24.84% |
U.S. Stocks 16.32% |
| Global Bonds 8.26% | Global Stocks 13.96% | Global Stocks 35.91% | Global Stocks 15.01% | Global Stocks 19.55% | U.S. Stocks 8.09% |
Global Stocks 14.99% | U.S. Stocks 4.23% |
Cdn. Stocks 22.88% |
Global Stocks 14.45% |
| U.S. Stocks 4.64% |
U.S. Stocks 13.43% |
Int’l Stocks 31.57% |
Balanced Portfolio 12.11% | Int’l Stocks 19.46% |
Balanced Portfolio 4.88% | U.S. Stocks 13.83% |
Cdn. Bonds 1.41% |
Global Stocks 21.91% | Balanced Portfolio 10.40% |
| Balanced Portfolio 0.94% | Balanced Portfolio 8.32% | Balanced Portfolio 19.17% | Cdn. Stocks 10.55% | Global Bonds 16.15% | Global Stocks 4.41% | Cdn. Stocks 9.10% |
Balanced Portfolio 1.15% | Int’l Stocks 16.45% |
Cdn. Bonds 8.68% |
| Global Stocks -2.67% | Cdn. Stocks 7.19% | Cdn. Stocks 12.99% | Global Bonds 9.65% | Balanced Portfolio 12.74% | Cdn. Bonds 1.66% |
Balanced Portfolio 8.46% | Global Stocks 0.06% |
Balanced Portfolio 14.41% | Global Bonds 7.29% |
| Cdn. Stocks -8.71% | Cdn. Bonds 3.60% |
Global Bonds 3.94% | Cdn. Bonds 8.79% | Cdn. Bonds 3.52% | Global Bonds -1.45% | Cdn. Bonds 2.52% |
Int’l Stocks -5.55% |
Cdn Bonds 6.87% |
Int’l Stocks 6.38% |
| Int’l Stocks -9.55% |
Global Bonds 2.01% | Cdn. Bonds -1.19% |
Int’l Stocks 4.12% | Cdn. Stocks -8.32% | Int’l Stocks -2.00% |
Global Bonds 0.34% | Cdn. Stocks -8.89% |
Global Bonds 1.44% | Cdn. Stocks 5.60% |
Source: Morningstar Direct, December 31, 2020. Canadian Stocks represented by S&P/TSX Composite Total Return Index, U.S. Stocks – S&P 500 Total Return Index (C$), International Stocks – MSCI EAFE Index (C$), Global Stocks – MSCI World Index (C$), Canadian Bonds – FTSE Canada Universe Bond Index, Global Bonds – Barclays Global Aggregate Bond Index (C$). Balanced Portfolio made up of 15% Cdn. Stocks / 45% Global Stocks / 10% Cdn. Bonds / 30% Global Bonds. The information provided is for illustrative purposes only and is not meant to provide investment advice. You cannot invest directly in an index. Calendar-year returns in Canadian dollars.
A Balanced Approach
Selecting certain asset classes over time and attempting to be consistently right year after year can be difficult. A balanced portfolio diversified across multiple asset classes and regions can help to both achieve strong returns as well as protect portfolios from the unpredictable swings of the market.
A balanced portfolio can help smooth out the ups and downs and remove much of the guesswork.
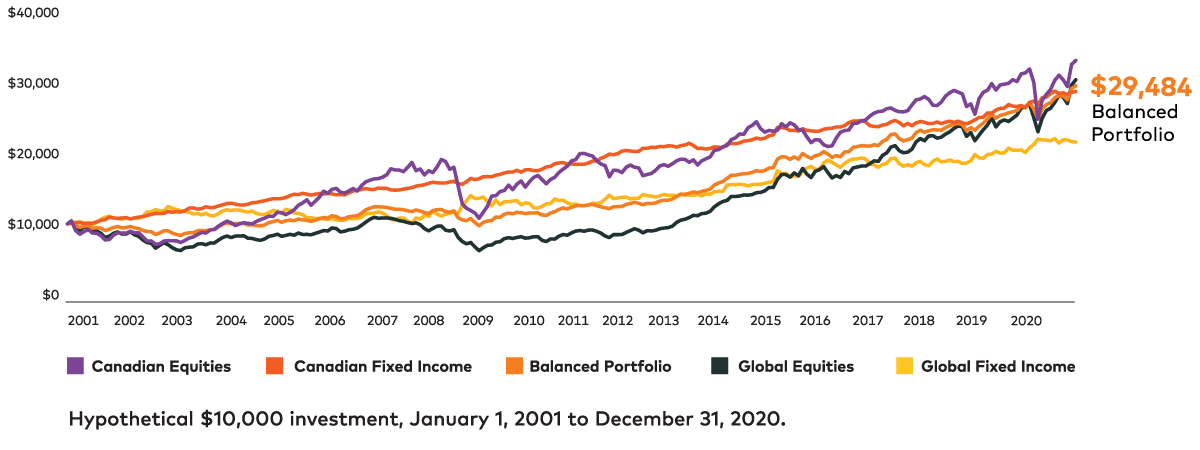
Source: AGF Investments Inc. The hypothetical portfolio weights and rates of return are for illustrative purposes only and should not be interpreted as a guarantee of future rates of return. The hypothetical portfolio is based on pre-determined investments in the above indexes with the portfolio weights rebalanced monthly. All returns are in Canadian dollars. The hypothetical portfolio is comprised of 30% Barclays Global Aggregate Bond Index, 10%. FTSE Canada Universe Bond Index, 45% MSCI World Index and 15% S&P/TSX Composite Index. For illustrative purposes only, you cannot invest directly in an index.