Earnings Multiples and Stock Market Performance
By: Bill DeRoche • October 7, 2020 • Quantitative
Equity market earnings multiples at their current elevated levels have historically led to lower equity returns over the long run. Higher earnings growth can mitigate this issue but could also lead to lower multiples thus reducing returns. Given this backdrop, investors need to consider additional ways of generating performance and mitigating risk including some allocation to alternative asset classes and strategies that offer the potential of non-correlated returns to traditional fixed income and long-only equity holdings.
Earnings Multiples versus Earnings Growth
Despite one of the most violent bear market corrections in recent history, valuations of most major stock indexes around the world have increased dramatically so far this year. This goes hand-in-hand with the remarkable rally off the market bottom that, in the U.S., recently culminated in new all-time highs. The S&P 500 Total Return Index (SPXT), for example, gained 51.75% from March 23, 2020 through the end of September, according to Bloomberg data, and has managed to generate a 5.57% return year-to-date even though economic activity remains severely depressed due to the global COVID 19 pandemic.
Given this large divergence between the real economy and equity markets, there is legitimate concern about performance prospects for U.S. equities going forward. And while the global pandemic and related factors—such as the self-induced economic shutdown and policies prescribed to combat it—have made for a highly unique market environment today, history can still provide valuable insights into probable market outcomes.
In fact, regardless of the historical backdrop, market performance can generally be categorized as either due to expansion or contraction of the earnings multiple and/or due to earnings growth or decline.
Using this equation, the relationship between prices and earnings growth is straightforward. Since prices reflect the present value of future cash flows and earnings generate those future cashflows, growing earnings directly leads to higher prices. Price/earnings (P/E) multiples react, however, to several market variables. In particular, changes in these market variables often expand or contract the P/E multiple thus indirectly influencing prices and overall market levels.
With the above framework in mind, it is important to determine what has the larger impact on equity returns: multiple expansion or earnings growth? Our analysis compared 10-year forward returns to one- year forward returns since January 1, 19501. The research evaluated the decomposition of these equity returns into the portion of the return that could be attributed to changes in the multiple and the portion explained by earnings growth. On average, for 10-year forward returns, 1% of the return is attributable to changes in multiples and 99% is attributable to earnings growth. For one-year forward returns, on average, 98% of the return is attributable to changes in multiples and 2% is attributable to earnings growth.
This result is not unexpected given the different annualized growth rates for the P/E multiple and earnings over history. Historical earnings over this period have grown at an average annual rate of 5.8% per year. Over a 10-year period, this equates to a compounded growth rate of approximately 76%. This compares to market P/E multiples that have, over this period, only modestly expanded at an historical rate of 1.8% per year and over a 10-year period, this equates to a compounded growth rate of approximately 20%.
A Deeper Dive on P/E Ratios
Given the impact P/E multiples can have on shorter term equity performance it makes sense to better understand the underlying market variables that influence them. P/E multiples are one of a few valuation metrics that investors use to compare investments relative to their own histories and to compare similar investments to one another by reflecting on what an investor is currently willing to pay for $1 of earnings.
P/E multiples use current prices or index levels in the numerator, while the earnings used in the denominator varies. The most used earnings metric is realized trailing 12-month earnings, but forward earnings estimates are also regularly used and reflect what investors are willing to pay for $1 of expected future earnings. Whether using trailing or estimated future earnings, higher multiples mean investors are willing to pay a higher price for $1 of earnings. How much higher, however, depends on several factors that influence P/E multiples, including discount rates, future earnings growth rates, returns on invested capital and changes in risk aversion. For instance, lower discount rates, higher earnings growth, higher returns on invested capital and lower risk aversion will all usually lead to higher P/E multiples.
For its part, the discount rate is the value that equates the current price or index level to the expected value in the future, or, simply stated, the expected return on the investment. A higher current price for an investment relative to earnings, as demonstrated by a higher P/E, equates to a lower discount rate and a lower expected return going forward. Policies, meanwhile, that lead to higher earnings growth or higher return on invested capital will lead to expanding P/E multiples, which, in turn, lead to higher contemporaneous returns, but lower expected returns in the future as investors pay more for $1 of future earnings.
Comparing Current Multiples with History
Understanding what is driving changes in market multiples is critical and, as was just referenced, lower discount rates equate to expanding multiples. Moreover, they are a function of the risk-free rate that is synonymous with U.S. Treasury yields, the equity risk premium and betas. So how do today’s multiples stack up against the past?
The tables below highlight several S&P 500 valuation ratios as they stood at the market lows on March 23, 2020 and September 30, 2020, and details their percentile ranks versus history.
| Valuation Ratio(s) | 23-Mar-2020 | 30-Sept-2020 |
|---|---|---|
| Trailing 12mth P/E | 14.69 | 26.13 |
| Forward Estimates P/E | 12.17 | 20.20 |
| Bloomberg Estimates P/E | 14.00 | 25.55 |
| Price to Book | 2.46 | 3.77 |
| Price to Cash Flow | 9.70 | 13.89 |
| Price to Free Cash Flow | 15.54 | 21.30 |
| Price to Sales | 1.61 | 2.48 |
| Estimated Enterprise Value-to-EBITDA | 10.15 | 15.67 |
| Enterprise Value-to-12MTH Trailing EBITDA | 10.02 | 16.30 |
| Enterprise Value-to-12MTH Trailing Sales | 1.87 | 2.70 |
Source: Bloomberg LP as of September 30, 2020
| Valuation Ratio Percentile Rankings | 23-Mar-2020 | 30-Sept-2020 |
|---|---|---|
| Trailing 12MTH P/E | 35.9% | 96.0% |
| Forward Estimates P/E | 14.9% | 92.5% |
| Bloomberg Estimates P/E | 15.3% | 98.4% |
| Price to Book | 27.6% | 87.9% |
| Price to Cash Flow | 41.0% | 79.9% |
| Price to Free Cash Flow | 17.9% | 45.7% |
| Price to Sales Ratio | 59.7% | 99.7% |
| Estimated Enterprise Value-to-EBITDA | 45.5% | 99.1% |
| Enterprise Value-to-12MTH Trailing EBITDA | 39.4% | 99.6% |
| Enterprise Value-to-12MTH Trailing Sales | 42.7% | 96.2% |
Source: Bloomberg LP as of September 30, 2020
In all instances, these ratios have expanded dramatically since the market lows back in March. And a number of these ratios are approaching all-time highs based on their percentile rank. In fact, the current market P/E multiple no matter which earnings metric is used in the denominator is very high relative to history, with all measures above the 90th percentile.
These levels provide further insights about the market variables that influence P/E multiples. The current high market multiples reflect a willingness by investors to pay more for $1 of future earnings than they have typically paid in the past. In other words, the discount rate implied by the current market multiple is low by historical standards and other market measures—including the Bloomberg Country Equity Risk Premium3 model—confirm this to be true.
Understanding the Impact of Sentiment on Returns
This suggests that future expected returns for the S&P 500 will be lower than what investors experienced over the prior 10 years, but expected returns tend to play out over extended periods of time. By contrast, sentiment can dominate expectations over shorter periods and, presently, the spread between the earnings yield of the S&P 500 and the U.S. Treasury yield remains elevated (although off the highs of March2).
| Yield Spread(s) | 23-Mar-2020 | 30-Sept-2020 |
|---|---|---|
| Estimate Dividend Yield | 2.78% | 1.75% |
| U.S. 10YR Treasury Yield | 0.79% | 0.68% |
| Earnings Dividend Yield MINUS 10YR Treasury Yield | 6.02% | 3.14% |
| Forward Earnings Yield MINUS 10YR Treasury Yield | 7.43% | 4.27% |
| Bloomberg Forward Earnings Yield MINUS 10YR Treasury Yield | 6.35% | 3.23% |
| Yield Spread Percentile Rankings | 23-Mar-2020 | 30-Sept-2020 |
|---|---|---|
| Estimate Dividend Yield | 96.6% | 0.8% |
| U.S. 10YR Treasury Yield | 0.7% | 0.6% |
| Earnings Dividend Yield MINUS 10YR Treasury Yield | 99.9% | 86.2% |
| Forward Earnings Yield MINUS 10YR Treasury Yield | 99.1% | 74.7% |
| Bloomberg Forward Earnings Yield MINUS 10YR Treasury Yield | 99.4% | 69.8% |
More to the point, because of the extremely low yields on U.S. Treasuries, investors have continued to show a risk preference for equities over bonds in recent months and they may continue to do so with the U.S. Federal Reserve having signaled a commitment to maintain government rates at very low levels for the foreseeable future—at least absent some negative catalyst that may arise to increase the equity risk premium that investors demand.
Strong equity sentiment coupled with low expected returns, therefore, creates a dilemma for investors. By itself, the large expansion of the P/E multiple is cause for concern; however, the Fed’s commitment to keeping rates low could prevent the P/E multiple from contracting and if government policies promote strong earnings growth, equity returns could still shine.
To address this scenario, we looked at history to assess the frequency of P/E multiples not contracting given an initial P/E multiple decile for the S&P 500. Using trailing 12-month earnings to calculate the P/E ratio and going back daily to December 31, 1949, we measured the percentage of time that the multiple expanded or remained constant over one, two, three, five and 10 years3.
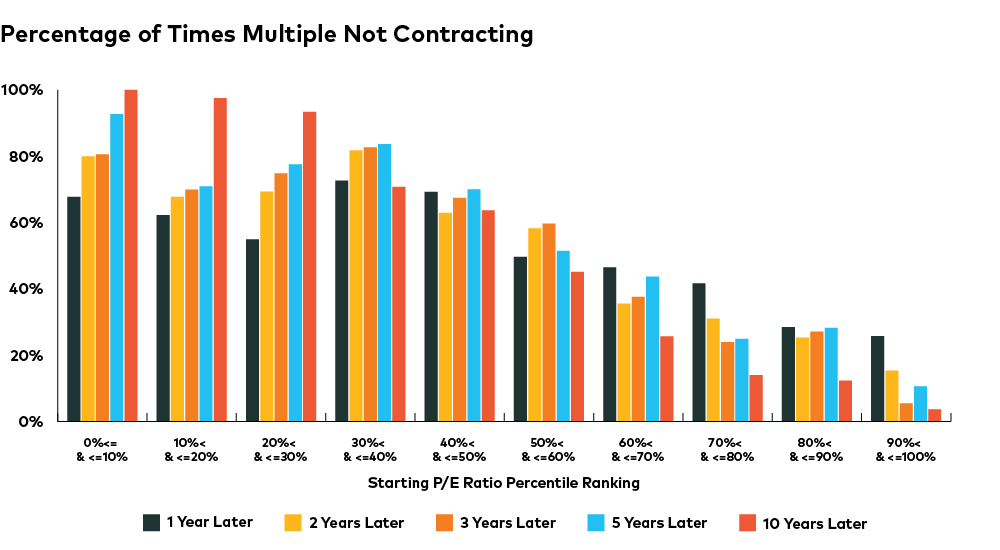
Through this research we found that the relationship between P/E expansion and contraction was highly dependent on the starting P/E multiple level relative to history. As the data shows, the higher the initial P/E multiple the less likely it has been for the P/E multiple to not contract over all time periods.
Although the expectation over the longer term is for the P/E multiple to retreat from current extreme levels, in the shorter-term, history has shown that the multiple can stay elevated for some time. Until U.S. Treasury rates move higher and investors demand a higher premium for investing in equities, P/E multiples should remain elevated and, in that case, earnings growth would be the sole driver of future returns.
Looking at earnings growth more closely, the data shows that earnings consistently grew over the entire dataset. More importantly, the longer the holding period, the higher the percentage of earnings growing. As the table below shows, it is not unusual for earnings to grow when P/E multiples are elevated.
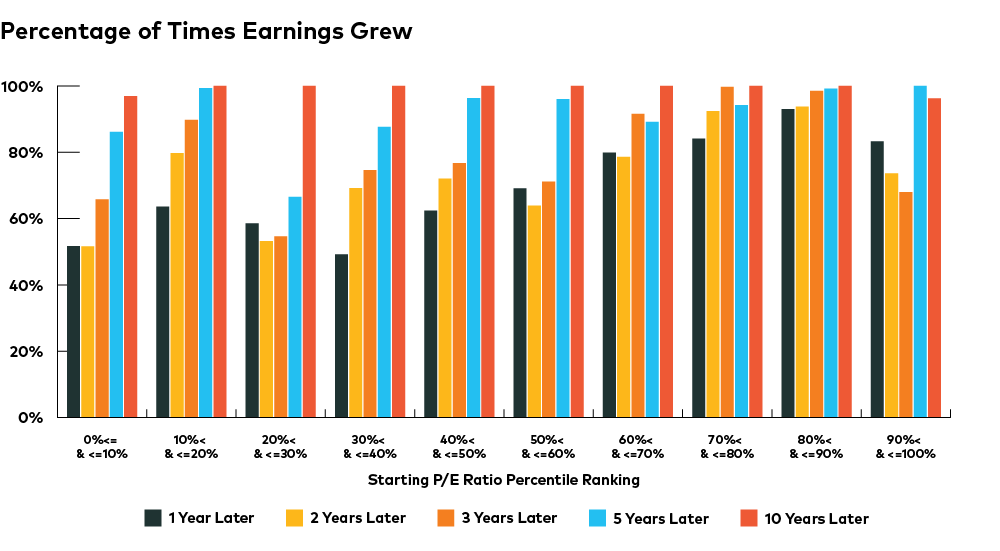
That said, earnings growth expectations implied by the current P/E multiple are very high. Using the forward P/E multiple on September 30, 2020 of 20.20x and an S&P 500 level of 3,363.00 implies earnings for the next year of more than $166.524. This is greater than the maximum 12-month trailing earnings during 2020 of $153 experienced back in January of 2020 and implies an earnings growth rate of 8.8%. Although higher than average, this rate could be achieved in a so-called V-shaped recovery, however, any setbacks in the recovery could lead to disappointments.
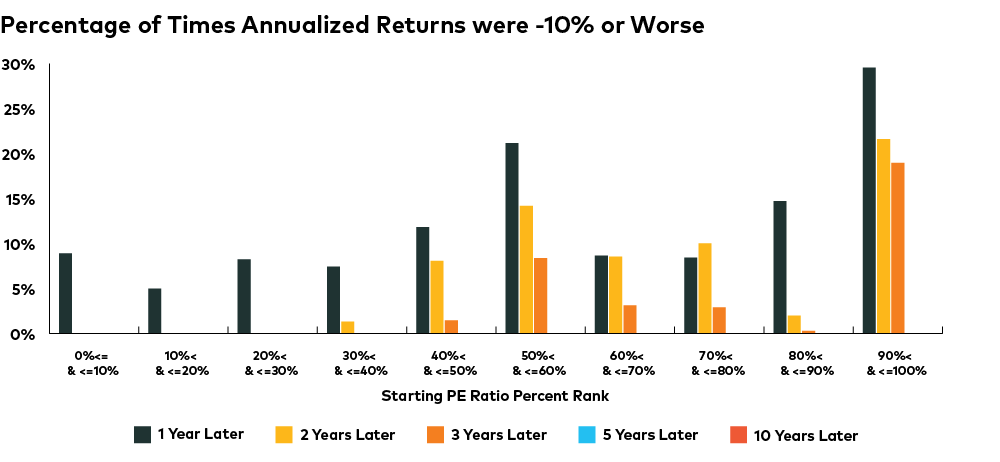
Lastly, our analysis considered those instances in history when the market experienced annualized returns of minus 10% or worse. On a positive note, we found that equities avoid negative returns over any extended holding period, however, it was also noted that elevated multiples led to higher frequencies of negative returns of 10% or worse.
Portfolio Implications
Although equities currently look attractive relative to bonds, the longer-term expectations for them given current market P/E multiples is more subdued. In this environment, investors should prudently manage their overall equity exposure, by seeking out alternative return streams that either provide exposures to risks with low correlation to fixed income and equities or mitigate the risks associated with these asset classes.
To that end, AGF has several alternative offerings, including private and public offerings, long-short strategies as well as alternative asset classes that include commodities and real assets.
1 Source: Bloomberg. Multiples are based on trailing earnings.
2 The earnings yield is the reciprocal of the PE multiple (1/PE).
3 The correlation of this series with the other PE multiples calculated using different earnings measures are above 80% in all instances.
4 Source: Bloomberg. A Forward PE Multiple of 20.20x times $166.52 of implied future earnings = $3,363.00, the level of the S&P500 Price Return Index on September 30, 2020.
The commentaries contained herein are provided as a general source of information based on information available as of September 30, 2020 and should not be considered as investment advice or an offer or solicitations to buy and/or sell securities. Every effort has been made to ensure accuracy in these commentaries at the time of publication, however, accuracy cannot be guaranteed. Investors are expected to obtain professional investment advice.
The views expressed in this blog are those of the author and do not necessarily represent the opinions of AGF, its subsidiaries or any of its affiliated companies, funds or investment strategies.
AGF Investments is a group of wholly owned subsidiaries of AGF and includes AGF Investments Inc., AGF Investments America Inc., AGF Investments LLC, AGF Asset Management (Asia) Limited and AGF International Advisors Company Limited. The term AGF Investments may refer to one or more of the direct or indirect subsidiaries of AGF or to all of them jointly. This term is used for convenience and does not precisely describe any of the separate companies, each of which manages its own affairs.
™ The ‘AGF’ logo is a trademark of AGF Management Limited and used under licence.